Visualize a preview table
In this tutorial you will learn how to use a simple visualization using metadata in the preview table.
Steps
Open Search tab using one of tutorials below.
Filter data in the preview table as needed.
Order data in the preview table as needed.
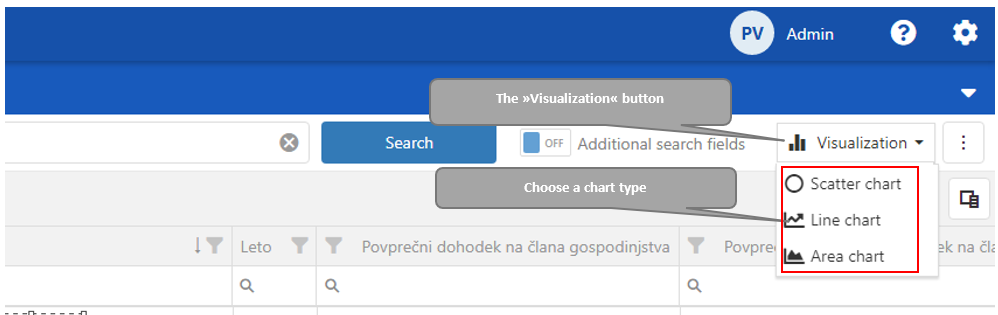
Data are ready for visualization. Click “Visualization“ button on the right upper corner. Click on the chart type.
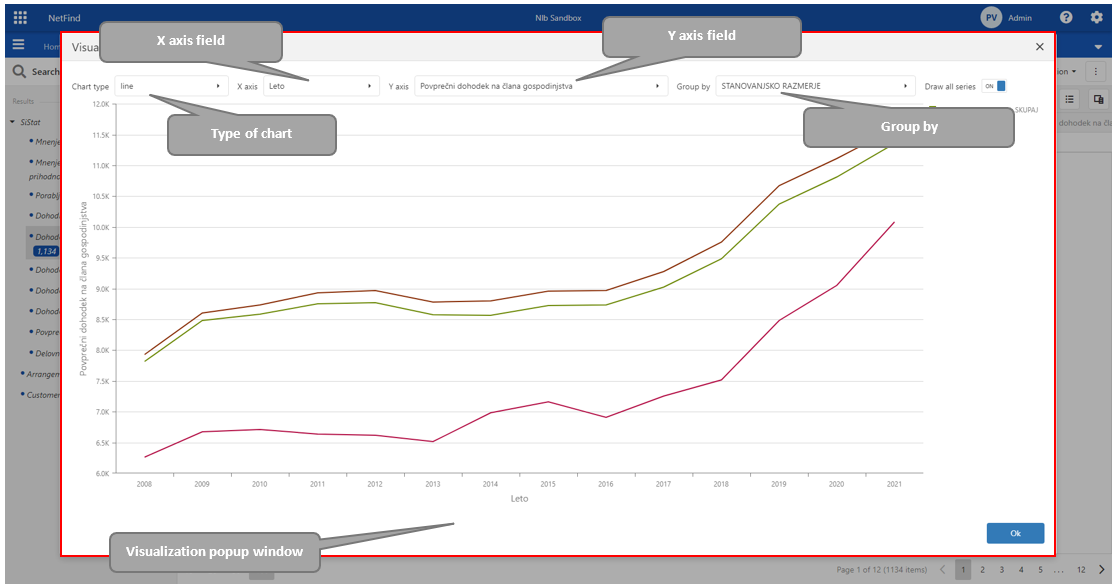
A popup window opens with data visualization form.
The user can easily change a “Type of chart“, “X-axis“, ”Y-axis” and “Group by“ fields. and switch to “Draw all series”.