
Debugging a process
Introduction
Whenever you create a new process or modify existing one, you would like to see how the process works. You could manually start a new process run and then check the results, but in this case there might be some additional information that you would like to inspect during the process execution.
To debug a process first open process designer as described in Modify a process page.
Start new debug run
Debug run is a special type of a process instance. For start, this process instance is not visible in the normal view and it contains more information about process execution. Regular process instance does not store any additional data, except the list of tables and their columns (and types). On the other hand a debug instance stores also the content of the tables that were created during its execution. Those tables will be visible in the environment section of process designer, and will indicate the environment of the current status of debug instance. You can inspect each table column and their data types and you can also preview the table contents.
To start a new debug run click on ![]() button in the menu bar. This will start a new debug instance and the first node in the process will be executed. Any potentially created tables and/or metadata will be visible in the Environment section.
button in the menu bar. This will start a new debug instance and the first node in the process will be executed. Any potentially created tables and/or metadata will be visible in the Environment section.
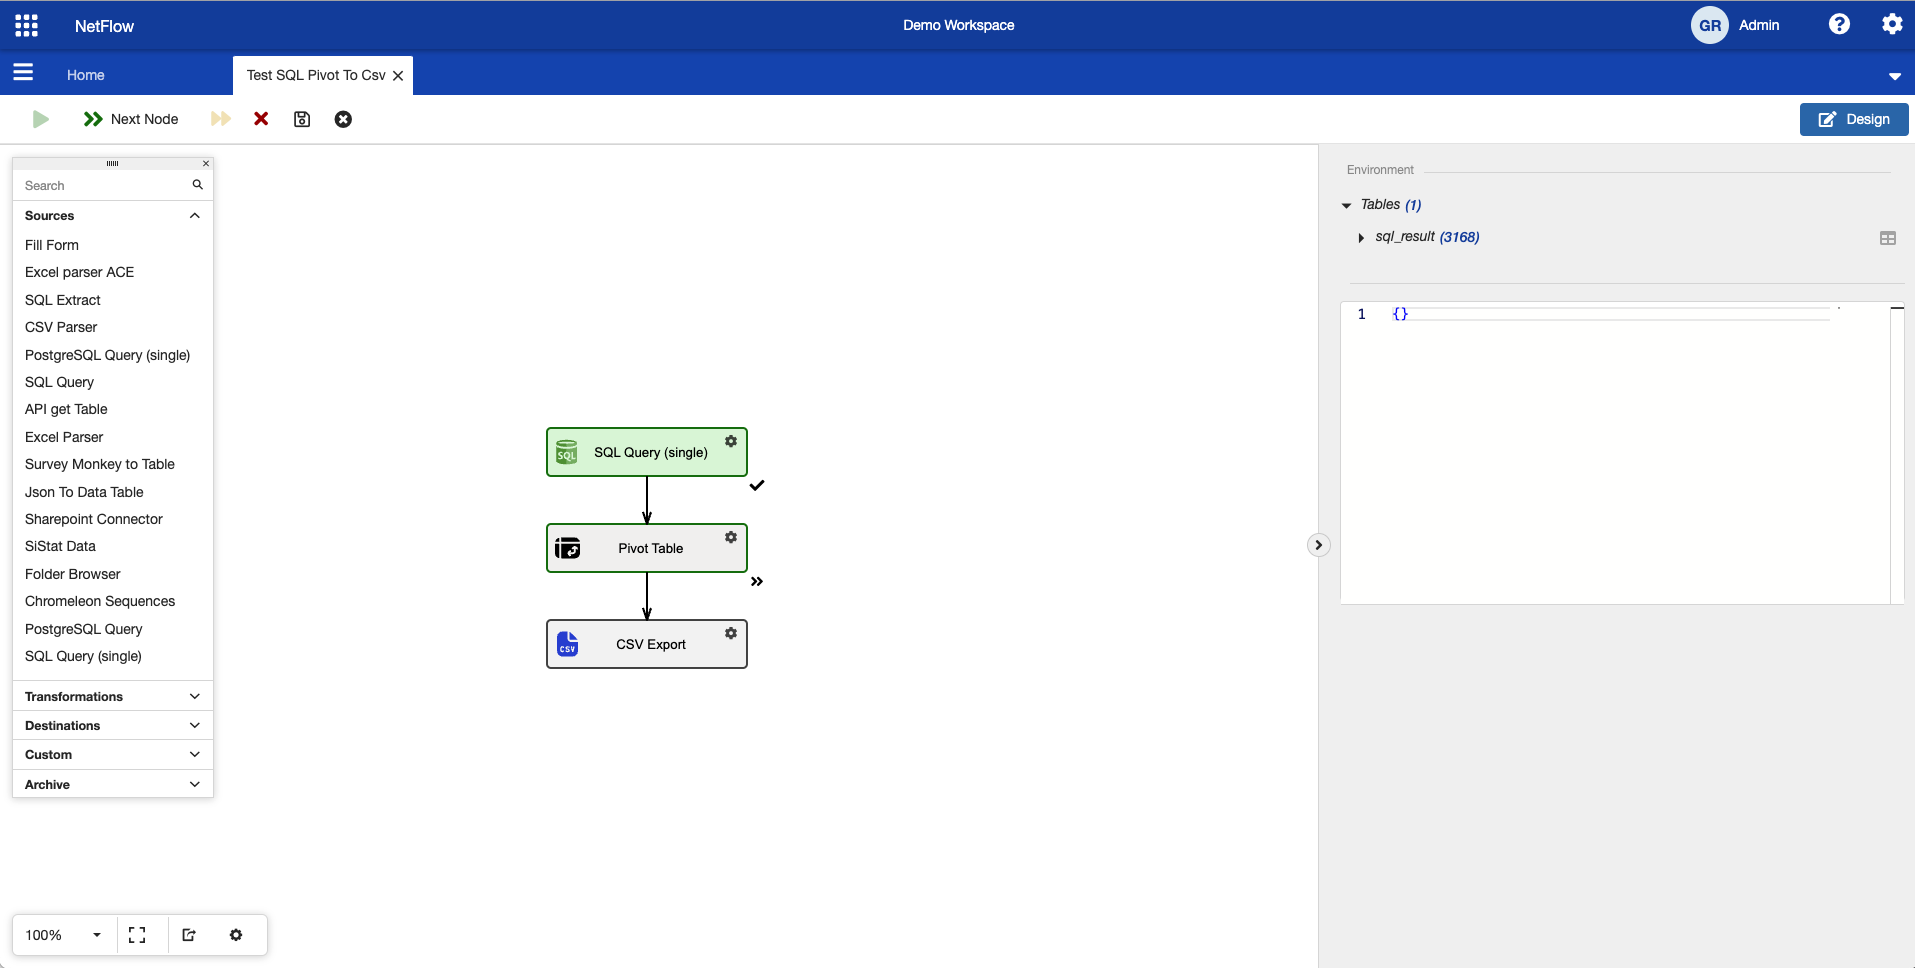
Debug run after starting new debug instance.
After first node is executed the debug run will pause and indicate which node will be executed next with ![]() icon.
icon.
Next node will be executed only after you press ![]() button in the menu bar.
button in the menu bar.
Usually it is recommended to check the tables in the environment section. The column names and their types are important when configuring latter nodes in the process. In the example above, the Pivot Table node needs to have configured some column from the table that was generated at the first step. To reduce the probability of miss configuration, check the column names of the table in the environment and set their correct values.
Interacting with debug environment
At this step you have some objects in the environment and you would like to inspect them. You can expand the table name to check its column and their data types, or click on ![]() icon near the table to open its preview. In the preview table pop up window you can for example filter and group table columns.
icon near the table to open its preview. In the preview table pop up window you can for example filter and group table columns.
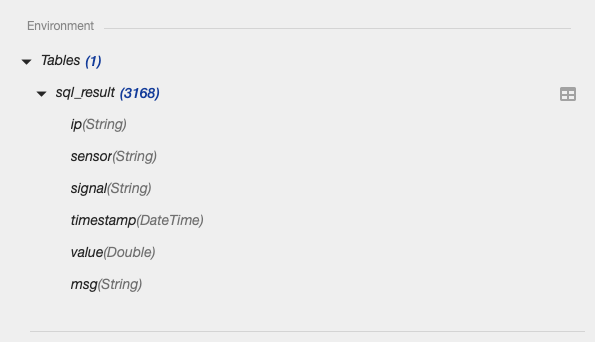
Debug environment table and columns.
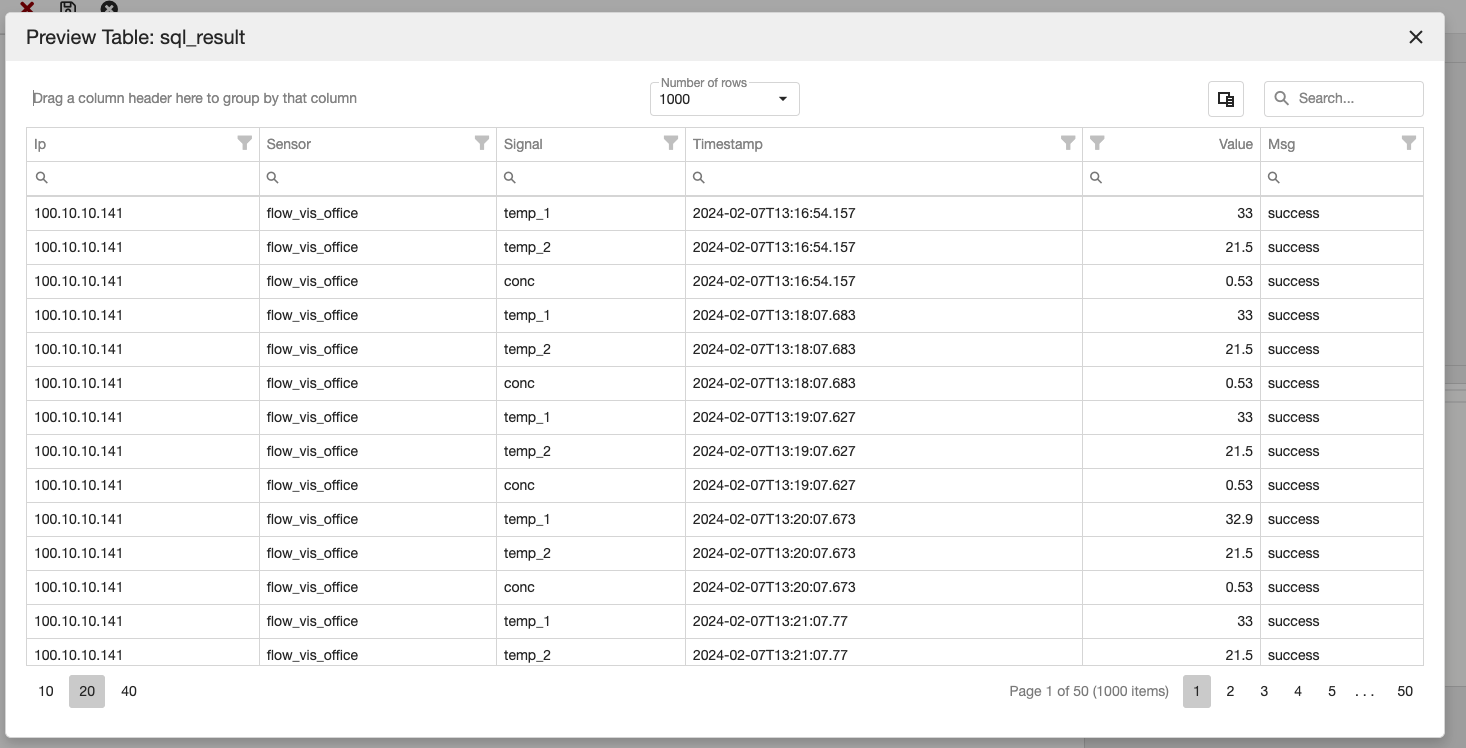
Preview table from debug environment.
Inspecting tables in debug environment is a crucial step when constructing a process. During the process execution you must verify that all the steps create desired results. Use the information from the environment to add or configure nodes in the process.
Continue with debug run
Afterward you have successfully started new debug run and inspect created environment you can continue with debug run. As already mentioned you need to press ![]() button to execute the next node. After next node is executed, the debug environment is modified as well.
button to execute the next node. After next node is executed, the debug environment is modified as well.
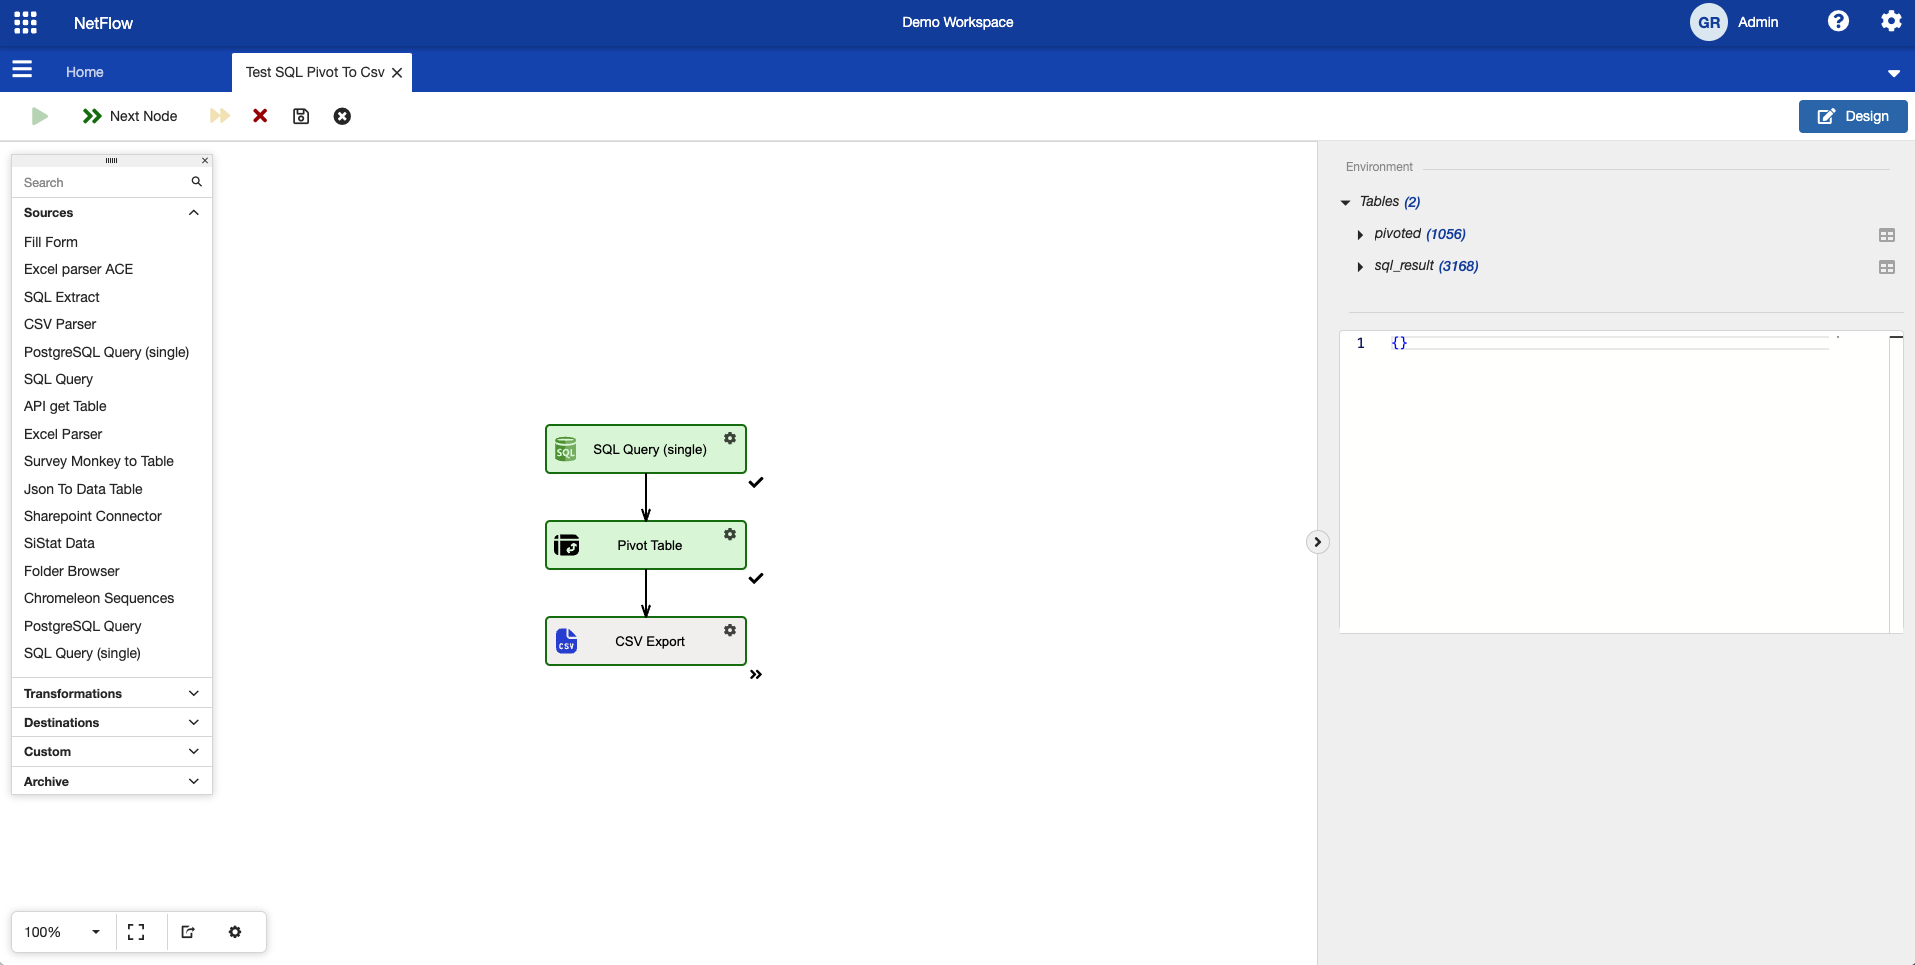
Debug run after two executed nodes.
As it can be seen, new table appeared in the debug environment and the process status have changed. At this step you can again inspect the newly created table. Using similar steps you can execute the entire process in debug mode.
Currently debug environment does not offer the functionality to download an inspect created files during process execution. To do so, you need to run the regular process instance by closing design mode and starting a new run.
Inspecting error messages
During execution of a process (in either mode) an error can happen. Errors can be due to miss configured nodes, incorrect source data, unavailability of databases and so on. Error messages can easily be inspected in the debug mode. The node where the error has happened will be coloured in red and the error message will be displayed in debug environment in the metadata section.
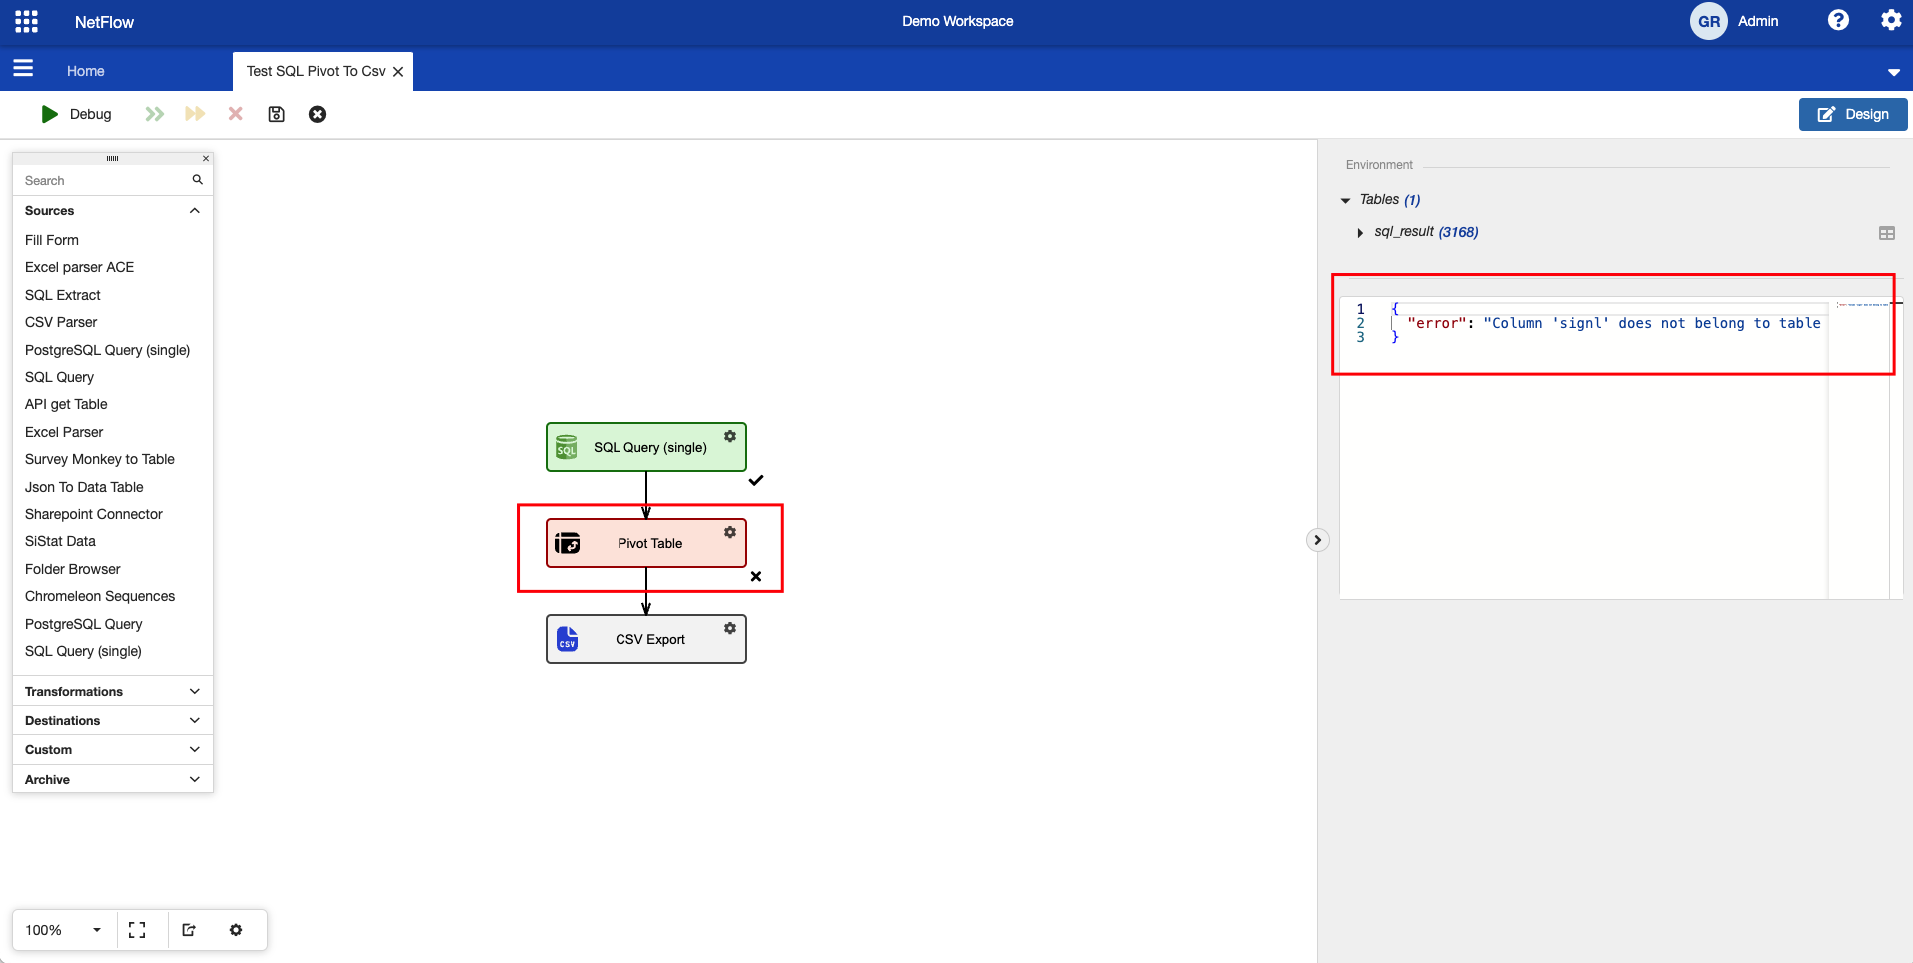
Inspecting error message in debug mode.
Process debugger is still an experimental feature and some minor bugs can happen. However, it is very useful in many scenarios and it is recommended that you use it during the construction of a process.