
Merging data from two different Excel files and importing to NetFind
What will you learn
Create new NetFlow process from scratch
Use NetFlow built-in Excel parsers and join two tables
Using NetFlow to import data to NetFind
After reading this example you should understand how Excel parsers works inside NetFlow. You should also be familiar with how to join two tables inside NetFlow by a common column and then save/import results in NetFind.
Prerequisites
Basic understanding of NetFlow processes module. If you are not familiar with this read Processes and Create new process pages.
Basic knowledge of Excel.
Baisc knowledge of NetFind module.
Introduction
Often you would like to compare to compare the data that is stored in different files. You would need to first get all the data “together” based on some logic and then perform desired comparison. This can be done in Excel itself, using VLOOKUP function, but this is limited to the Excel files. If one part of the data would be in a different (csv for example) file this could become more complicated. Using NetLab is easy to upload, parse and merge multiple excel (or different files).
Example description
In this example we will be using the crime vs. gdp dataset which was available on https://www.kaggle.com/datasets/fxvdinxnd/correlation-data . If the link is not available any more you can download the data directly from archive (10).zip
In this dataset we will be interested in two files. The first one is organized_crime.xlsx, which contains crimality index (among other) of every country. The second file is gdp_per_capita.xlsx, which contains the gdp per capita information for (almost) every country. We would like to merge those two data and compare the correlation between criminality index and gdp per capita.
To do so, we will create a process in NetFlow, where we will upload those two files, then parse both of them and merge them using built-in https://netica.atlassian.net/wiki/spaces/NLDD/pages/1802371559 node. Finally we will use NetFind Table Import Node to import results in NetFind and compare them.
Steps
Step 1 - Creating new process
Go to NetFlow mofule and click on ![]() icon. Then click on + New Process button and select Blank process from the templates selection. Click on Next and a new process page should open up. Now select the Fill Form node from the nodes list and drag&drop it into process pane. Click on settings
icon. Then click on + New Process button and select Blank process from the templates selection. Click on Next and a new process page should open up. Now select the Fill Form node from the nodes list and drag&drop it into process pane. Click on settings ![]() icon in this nodes and select File Upload form from the dropdown menu. Then click on
icon in this nodes and select File Upload form from the dropdown menu. Then click on ![]() icon to save the process. Enter process name and select process group. Then click on Save and the process should be created.
icon to save the process. Enter process name and select process group. Then click on Save and the process should be created.
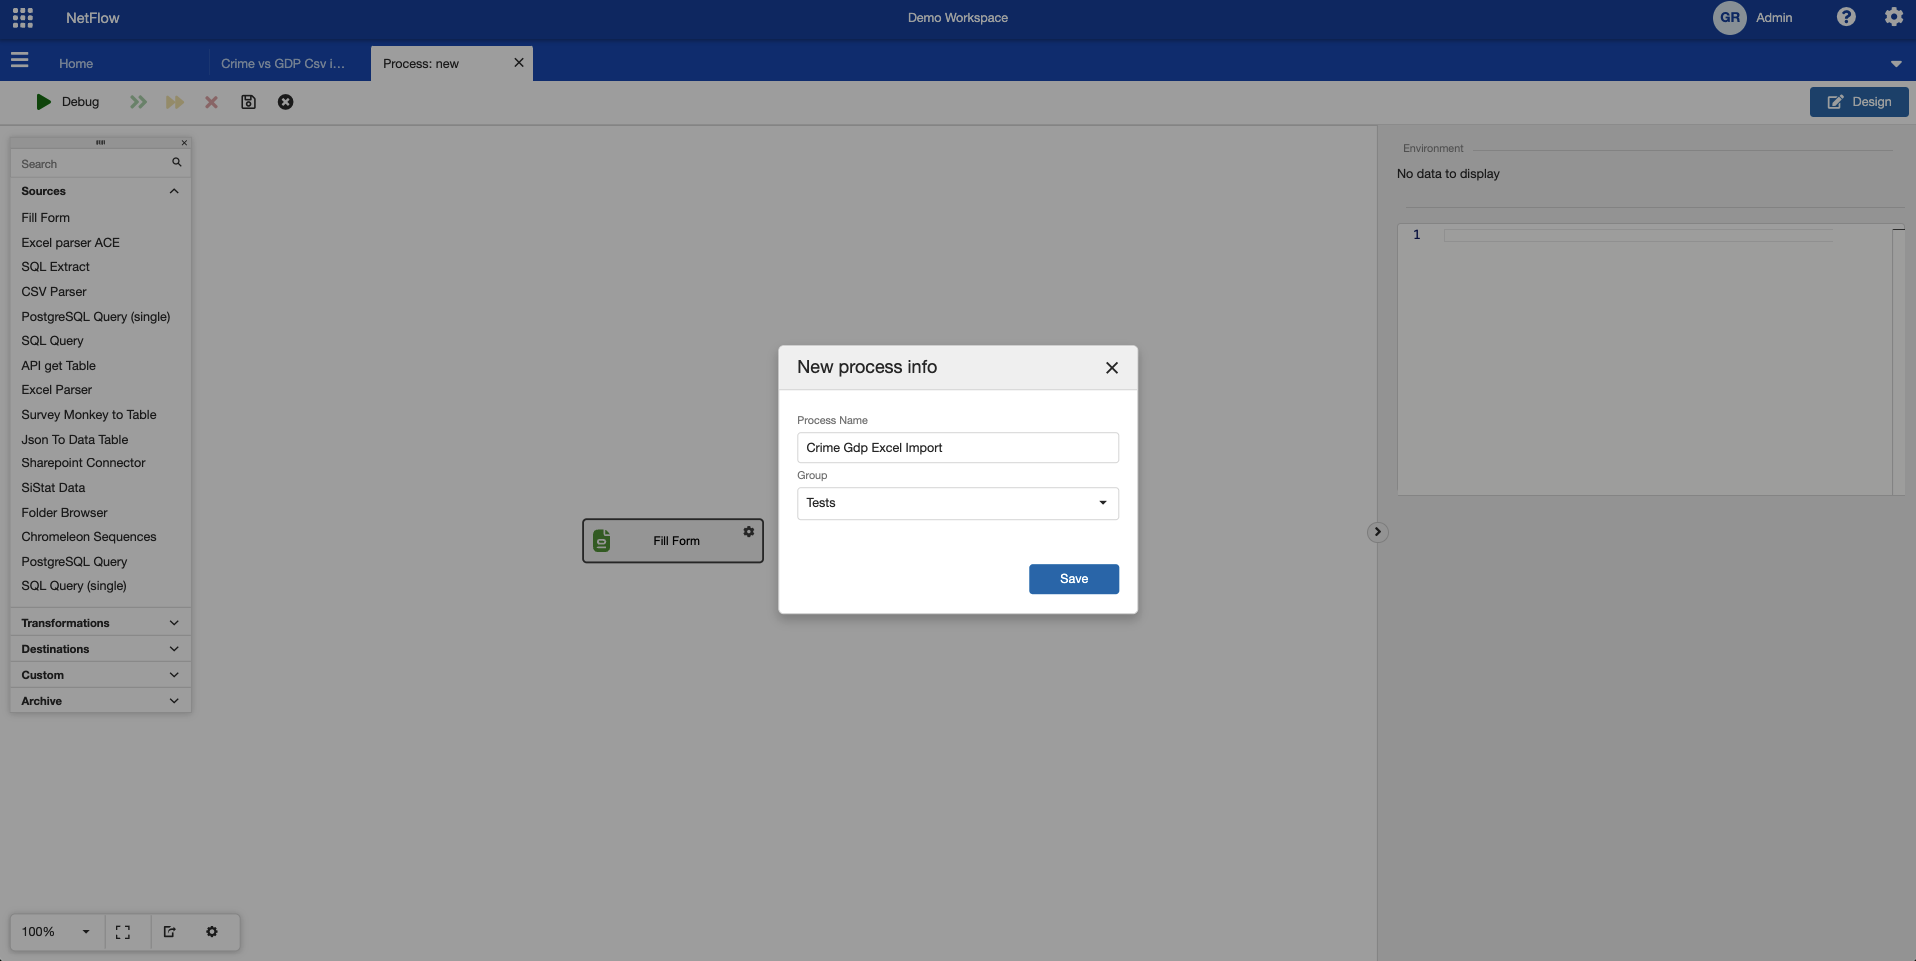
Creating a new process.
Step 2 - Adding parser nodes
At this step the process is created, but in only contains Fill Form node. This node will let use upload (multiple) excel files into it. The next step is, to convert those files into tabular format using Excel Parser Node .
Find Excel Parser Node and connect it with Fill Form node. Now add another Excel Parser Node and connect it with Fill Form. Those two nodes will parse different excel files. One will parse excel containing crime data and other will parse file containing gdp data.
Before continue with configuration of those two nodes it is good to save current work so click on ![]() icon to save the process.
icon to save the process.
Crime Data parser settings
Now open settings of one of Excel parser nodes and set the following configuration:
FilePath = @filePaths
Regex filter = crime
Use Datatype = true
Output Table = crime_data
Included Sheets = 2021_dataset
Click on the Save button to save the changes. This node will parse the crime data, where only 2021_dataset sheet will be included. The resulting table name will be crime_data.
Gdp Data parser settings
Now open the settings of the other Excel parser node and set the following configuration:
FilePath = @filePaths
Regex filter = gdp
Use Datatype = true
Output Table = gdp_data
Click on the Save button to save the changes. This node will parse the gdp data and the resulting table name will be gdp_data.
Now Save the process changes by clicking on ![]() icon.
icon.
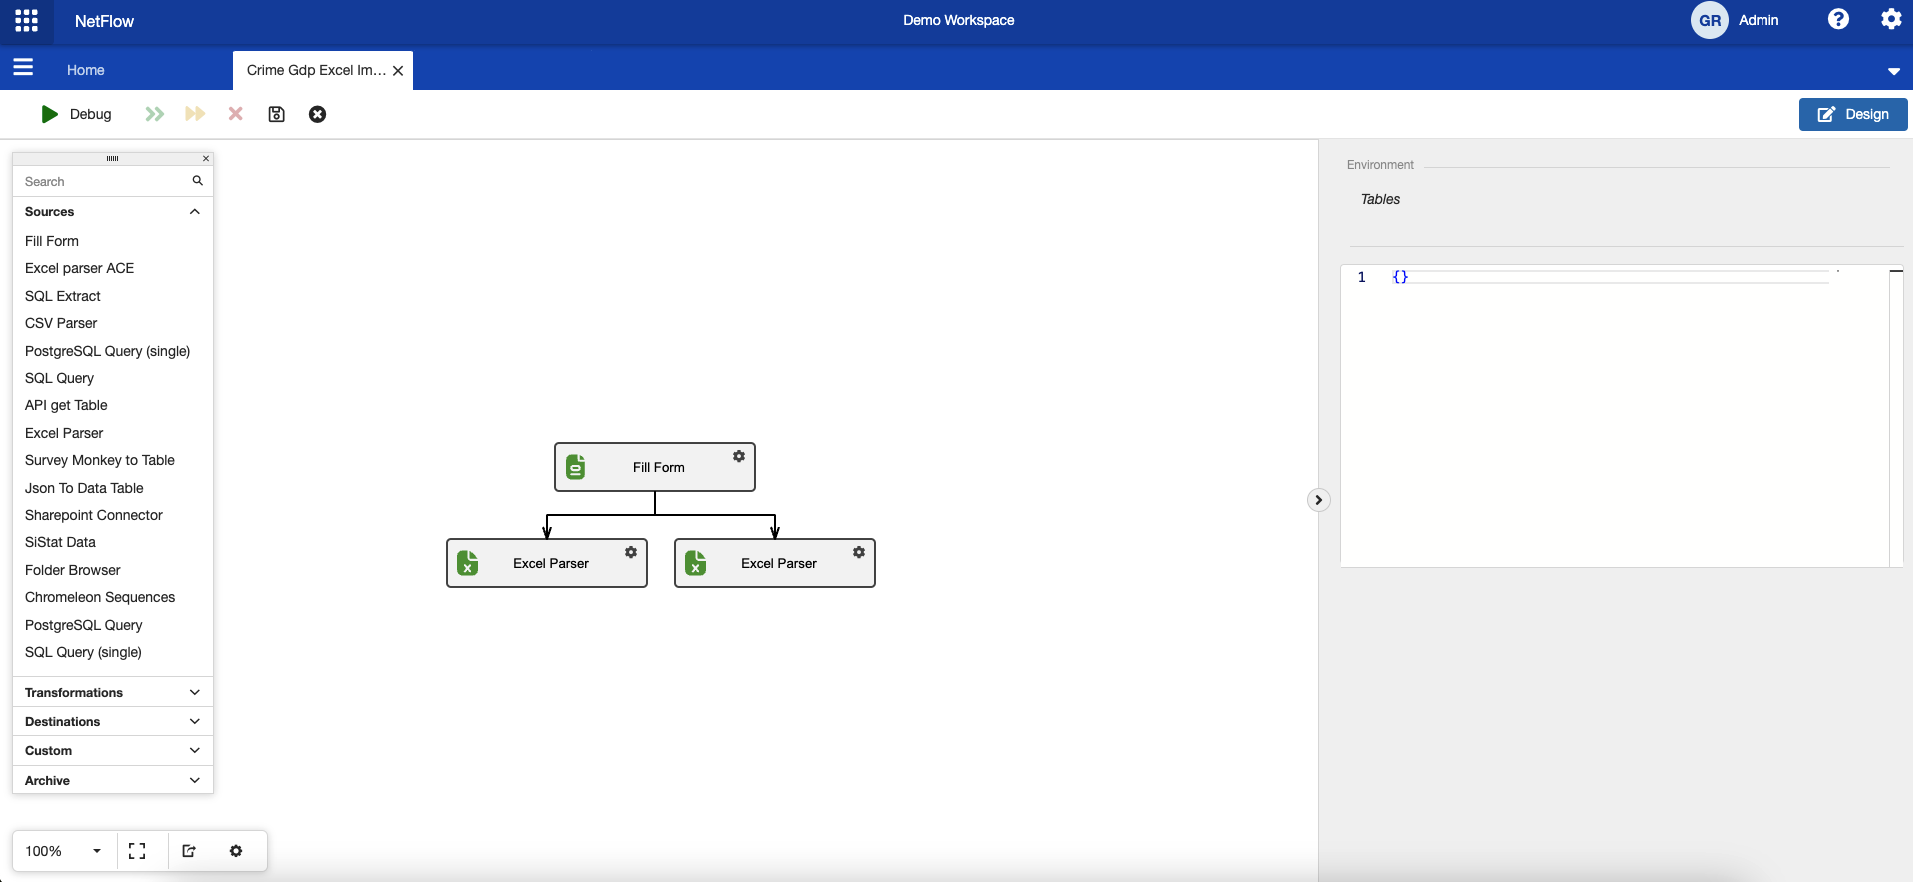
Process after adding parser nodes.
Step 3 - Adding Join Node
At this step there should be two tables available in the process. This are crime_data and gdp_data. Observing the source Excel files, we would like to merge those two tables by the column Country from crime_data and column Countr/Area from gdp_data. To do so find https://netica.atlassian.net/wiki/spaces/NLDD/pages/1802371559 node and add it into process. Connect it with both Excel Parser nodes. Open its settings and set the following properties:
Left Table = crime_data
Left Column = Country
Right Table = gdp_data
Right Column = Country/Area
Output Table = merged_data
This node will create a new table named merged_data, which will contain the columns from both tables (left and right). Click on Save button to save the changes and save the process changes by clicking ![]()
Sometimes it is good to add a Auto Column Types node, so that the data types of columns are determined (if the source Excel files have some strange formats). Therefore add Auto Column Node and connect it with Join Table Node. Then save the process by clicking ![]() icon. Note that this node do not need any special settings.
icon. Note that this node do not need any special settings.
Step 4 - Importing to NetFind
At this step the table is ready to be imported into NetFind. To do so find NetFind Table Import Node and add it to process. Connect it with Auto Column Node and open its cofiguration. Set the following properties:
Input Table = merged_data
Elastic Index Name = crime_data
Recreate Index = ON
Auto Create View = ON
Batch Size = 500
Click on Save button to save the changes and save the process changes by clicking on ![]() icon. This node will import previously created merge_data table into NetFind.
icon. This node will import previously created merge_data table into NetFind.
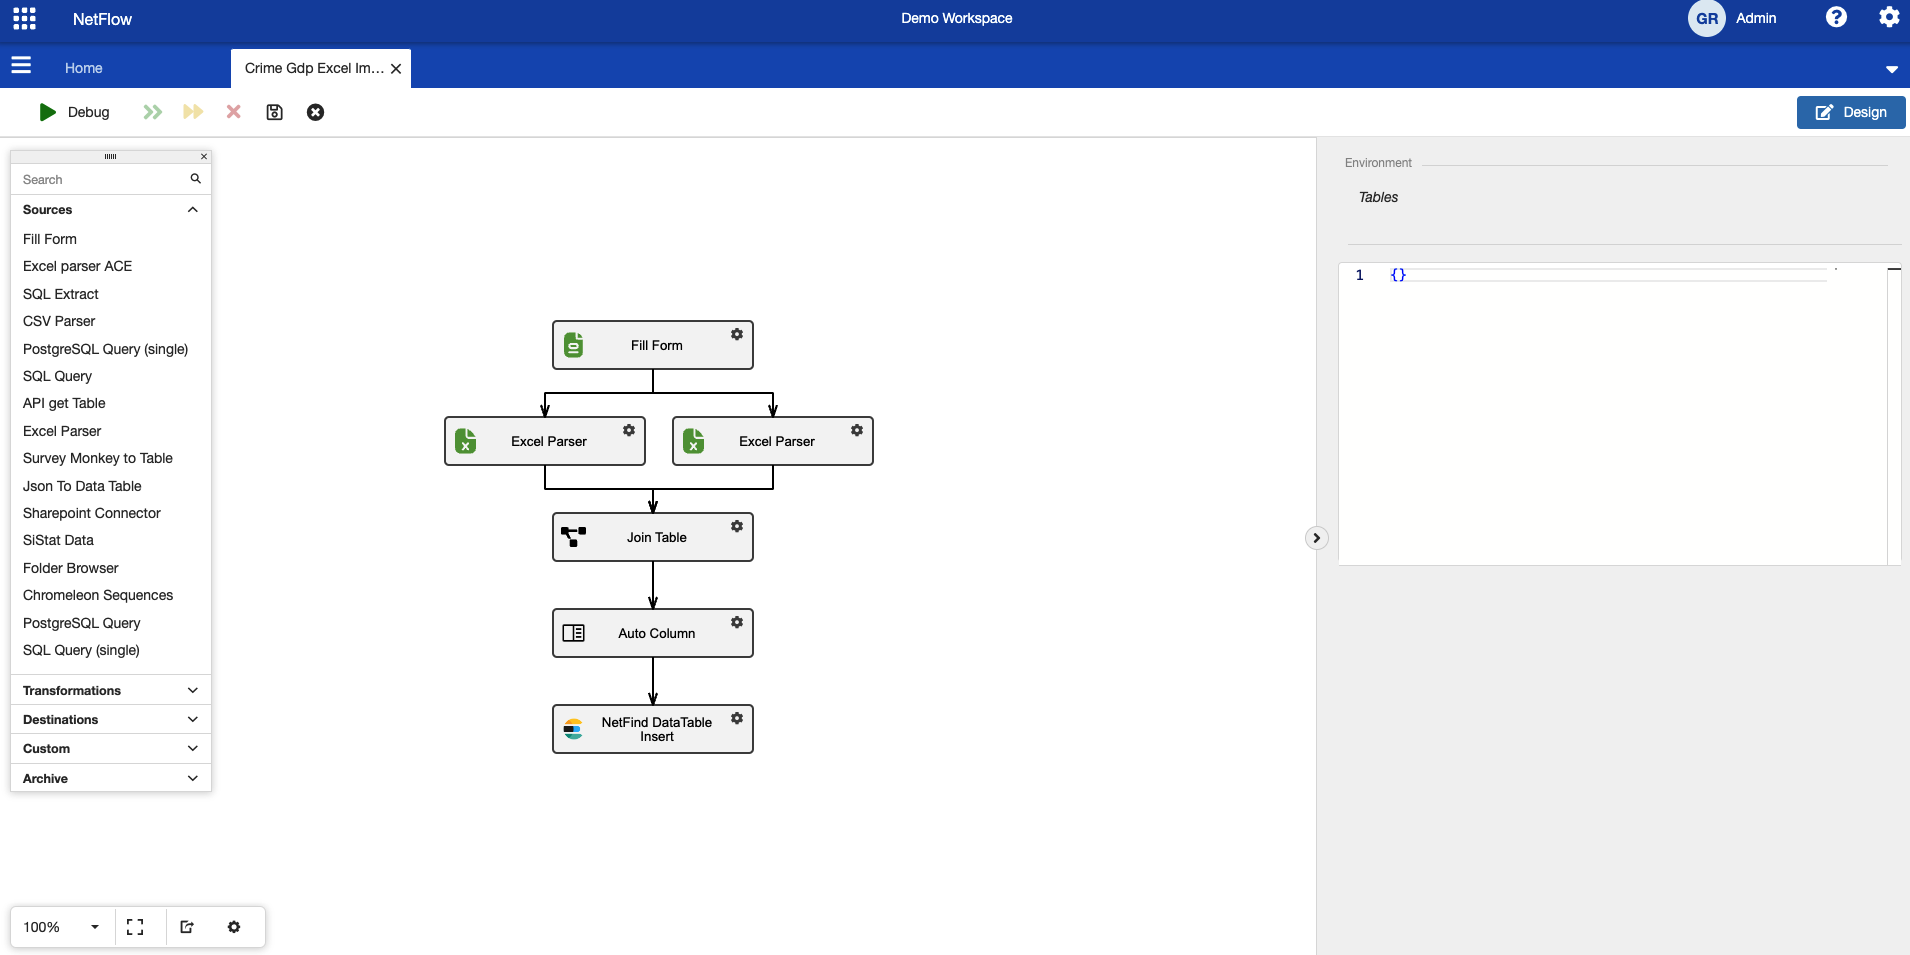
Final process schema.
Step 5 - Running the process and comparing results in NetFind
The process is now created and can be executed. Click on Design button to close designer mode and click on Run button to start new run. Process should start and then stop in the first node where we must upload excel files. Click on ![]() button to open the form and upload both excel files.
button to open the form and upload both excel files.
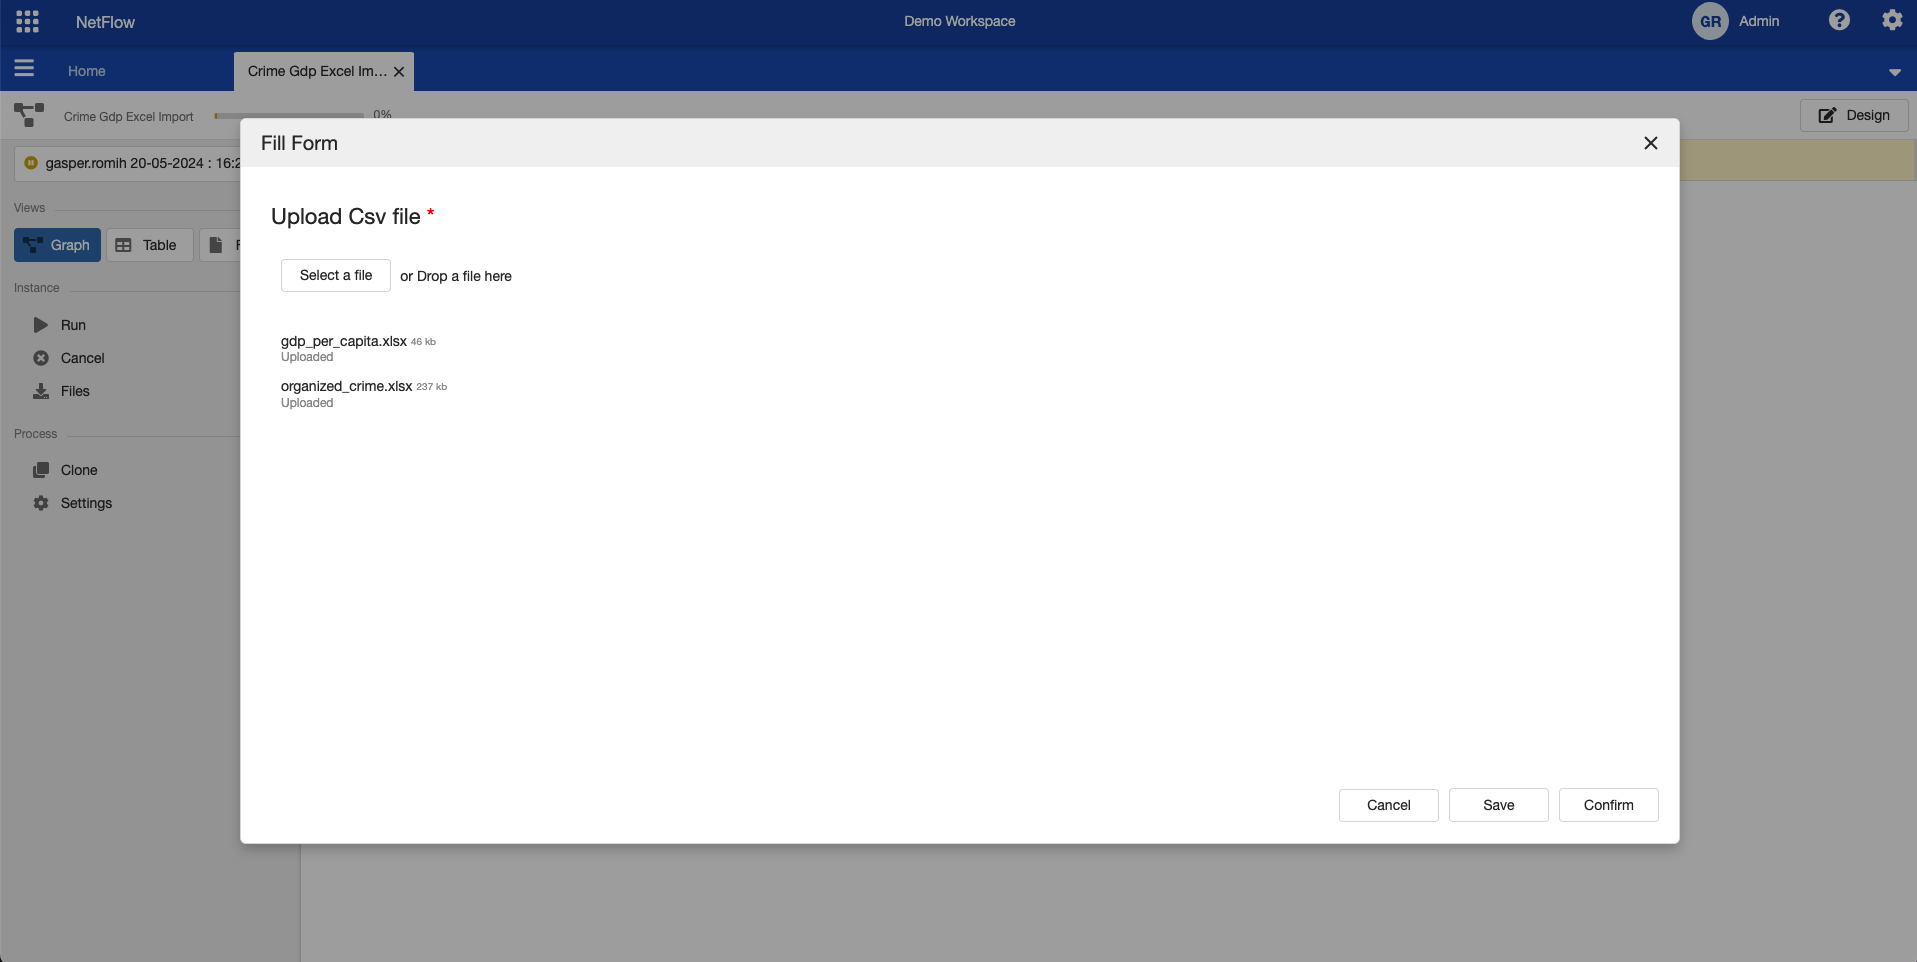
Uploading excel files.
Once both excel files are uploaded click on Confirm button to continue with the process. The process should automatically continue and successfully finish. At this step the results are already imported into NetFind and we can look at them.
To do so, switch to NetFind module by click on ![]() icon and then selecting NetFind. Open
icon and then selecting NetFind. Open ![]() icon and then click on New Search. In the view list on the left hand side you should see crime_data view. Click on it to display results.
icon and then click on New Search. In the view list on the left hand side you should see crime_data view. Click on it to display results.
Now click on Visualizations and select Scatter plot. Select GDP Per Capita GDP - US Dollars as X axis and Criminality on Y axis. This should create a correlation between gdp value and the criminality index of a country.
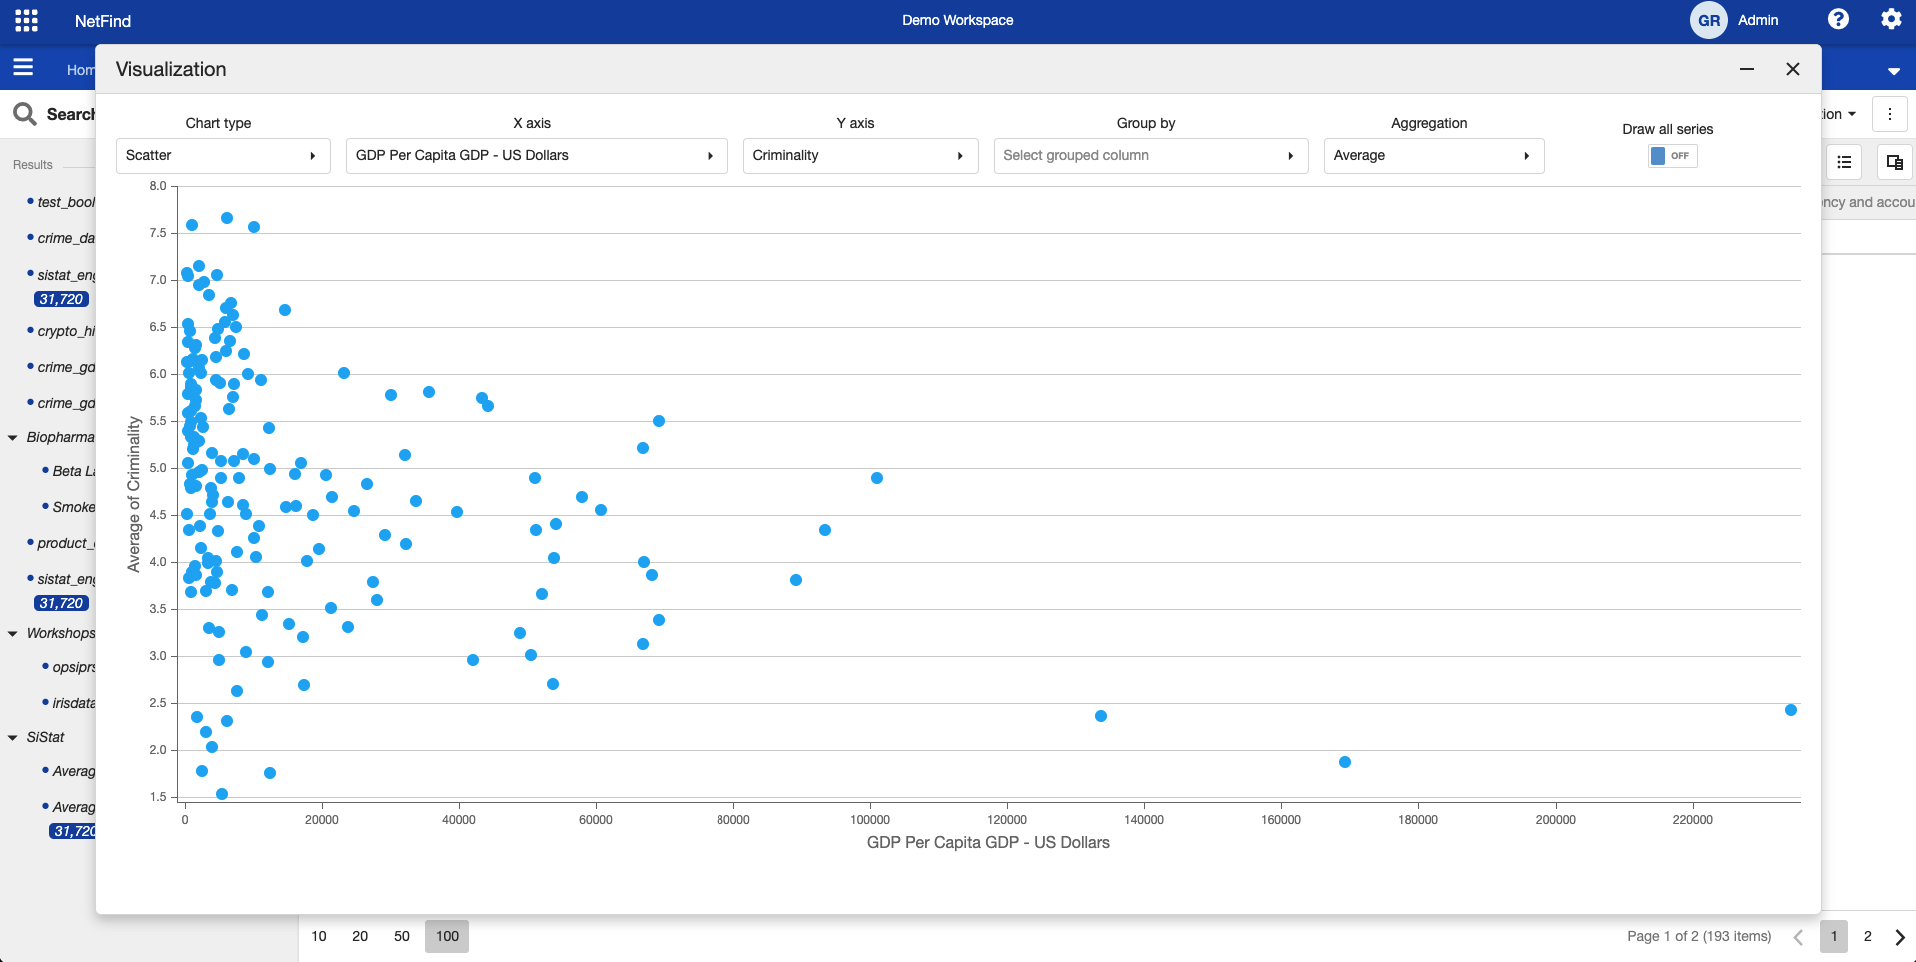
Comparison between gdp and criminality index.